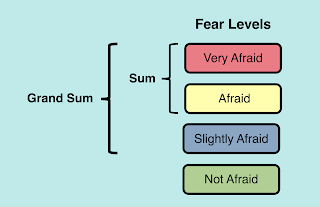
From 2014 to 2019 Chapman University produced an annual survey of American fears. They didn’t do one in 2020. In late September they produced results from a seventh survey with 95 questions, described as Wave 7 (2020/2021). It was done between January 5 and 15 of 2021 on a sample of 1035 U.S. adults, so it has a margin of error of plus or minus 3.0%. They asked how afraid people were, with four possible answers of Very Afraid, Afraid, Slightly Afraid, or Not Afraid. For some questions there were a few non-responses listed a Web Blank. As usual, they reported their results via a blog post listing the ranks based on the Sum of percentages for Very Afraid plus Afraid (which I discussed in my blog post on September 26, 2021).
Another way to report the results is with the percentages for Slightly Afraid also added, to produce a Grand Sum, as shown above. This produces larger, scarier numbers for marketing purposes (but is slightly silly for including that possibly insignificant fear level).
Also, I calculated the Fear Score for each question (on a scale from 1 to 4, where 1= Not Afraid, 2=Slightly Afraid, 3=Afraid, and 4=Very Afraid), as I described in a blog post about the 2015 survey. The following list shows the ranking for the Grand Sum (T), the ranking for the Sum (S), the question, question number, percentage, and the Fear Score. In this case public speaking was ranked #45 at 61.7% (versus #54 and 29.0% for the Sum).
T01} S01] Corrupt government officials Q21b, 94.0% 3.175
T02} S05] Widespread civil unrest Q16n, 88.6% 2.717
T03} S04] People I love becoming seriously ill Q10b, 87.6% 2.732
T04} S07] Economic/financial collapse Q16l, 87.5% 2.681
T05} S02] People I love dying Q10d, 86.1% 2.744
T06} S21] Identity theft Q18o, 85.2% 2.476
T07} S03] A loved one contacting the coronavirus (COVID-19) Q28b, 85.1% 2.739
T08} S06] A pandemic or a major epidemic Q16m, 85.0% 2.681
T09} S08] Cyber-terrorism Q15c, 84.9% 2.565
T10} S12] A terrorist attack Q16s, 83.9% 2.546
T11} S09] Pollution of oceans, rivers and lakes Q13c, 82.2% 2.542
T12] S10] Biological warfare Q16r, 81.0% 2.547
T13} S15] The US becoming involved in another world war Q16o, 80.6% 2.523
T14} S32] Credit card fraud Q18p, 80.1% 2.331
T15} S28] Air pollution Q13a, 79.2% 2.354
T16} S37] Being hit by a drunk driver Q18e, 78.6% 2.313
T17} S25] Government use of drones within the US Q21a, 77.6% 2.355
T18} S14] Not having enough money for the future Q14a, 77.5% 2.539
T19} S16] Government tracking of personal data Q15e, 76.6% 2.441
T20} S17] Corporate tracking of personal data Q15d, 76.1% 2.397
T21} S22] Iran using nuclear weapons Q16u, 76.0% 2.400
T22} S18] Pollution of drinking water Q13b, 75.8% 2.375
T23} S20] Government interference with the coronavirus (COVID-19) vaccine approval Q21d, 75.7% 2.400
T24} S38] The collapse of the electrical grid Q16i, 75.4% 2.269
T25} S52] Theft of property Q18l, 75.2% 2.176
T26} S26] North Korea using nuclear weapons Q16t, 74.9% 2.388
T27} S33] Becoming seriously ill Q10a, 74.9% 2.286
T28} S34] Catching the coronavirus Q14g, 74.2% 2.305
T29} S27] A nuclear weapons attack Q16j, 73.9% 2.399
T30} S19] Extinction of plant and animal species Q13d, 73.5% 2.365
T31} S13] Global warming and climate change Q13f, 73.0% 2.452
T32} S31] Terrorism Q18r, 72.7% 2.331
T33} S47] Break-ins Q18k, 71.5% 2.163
T34} S11] Government restrictions on firearms and ammunition Q21c, 71.2% 2.443
T35} S36] Random/mass shooting Q18j, 70.9% 2.281
T36} S29] Contracting the coronavirus (COVID-19) Q28a, 70.8% 2.201
T37} S30] A nuclear accident/meltdown Q16k, 69.8% 2.271
T38} S24] High medical bills Q14e, 69.6% 2.340
T39} S46] Heights Q17m, 68.7% 2.139
T40} S41] Oil spills Q13e, 68.7% 2.122
T41} S40] A devastating drought Q16f, 66.9% 2.135
T42} S53] Dying Q10c, 65.0% 2.072
T43} S23] White supremacists Q19b, 64.0% 2.283
T44} S61] Mugging Q18a, 63.1% 2.028
T45} S54] Public speaking Q17n, 61.7% 2.023
T46} S39] A devastating wildfire Q16g, 61.6% 2.101
T47} S67] Reptiles (snakes, lizards, etc.) Q17d, 60.6% 1.980
T48} S62] Computers replacing people in the workforce Q15a, 60.3% 1.973
T49} S48] A devastating tornado Q16c, 59.7% 2.024
T50} S51] Sharks Q17f, 59.2% 2.010
T51} S43] A devastating earthquake Q16a, 58.8% 2.046
T52} S73] Walking alone at night Q17r, 58.8% 1.902
T53} S35] Right wing extremists Q19g, 58.1% 2.001
T54} S44] Racial/hate crime Q18i, 57.8% 2.064
T55} S75] Germs Q17h, 57.5% 1.864
T56} S70] Insects/arachnids (spiders, bees, etc.) Q17c, 57.1% 1.876
T57} S55] Murder by a stranger Q18c, 56.1% 2.009
T58} S45] A devastating hurricane Q16b, 55.6% 2.008
T59} S59] A devastating flood Q16d, 55.5% 1.964
T60} S63] Financial fraud Q18q, 55.5% 1.931
T61} S58] Gang violence Q18m, 55.3% 1.985
T62} S66] A devastating blizzard/winter storm Q16e, 52.6% 1.878
T63} S49] Not having enough money to pay my rent or mortgage Q14c, 50.5% 1.867
T64} S56] Left wing extremists Q19h, 50.2% 1.786
T65} S50] Police brutality Q18f, 49.1% 1.949
T66} S42] The Proud Boys Q19d, 48.6% 1.756
T67} S68] Deep lakes and oceans Q17i, 48.3% 1.848
T68} S77] Murder hornets Q17l, 48.2% 1.768
T69} S57] Being unemployed Q14d, 47.5% 1.654
T70} S86] Strangers Q17q, 47.1% 1.621
T71} S81] Small, enclosed spaces Q17o, 46.7% 1.698
T72} S82] Technology that I don’t understand Q15b, 46.2% 1.669
T73} S60] Sexual assault by a stranger Q18g, 45.6% 1.899
T74} S80] Catching influenza (the seasonal flu) Q14f, 44.7% 1.657
T75} S76] Illegal immigration Q16q, 42.9% 1.746
T76} S69] Stalking Q18b, 42.3% 1.772
T77} S65] Abduction/kidnapping Q18n, 42.0% 1.838
T78} S64] Losing your job due to the coronavirus (COVID-19) pandemic Q28c, 41.0% 1.807
T79} S72] Antifa Q19a, 39.8% 1.513
T80} S78] A large volcanic eruption Q16h, 37.7% 1.651
T81} S74] Murder by someone you know Q18d, 36.1% 1.709
T82} S85] Flying Q17j, 34.6% 1.515
T83} S71] Sexual assault by someone you know Q18h, 32.9% 1.696
T84} S83] Black Lives Matter (BLM) Q19c, 31.3% 1.529
T85} S84] Needles Q17b, 31.3% 1.474
T86} S95] Animals (dogs, rats, etc.) Q17e, 27.1% 1.332
T87} S79] Not being able to pay off the college debt of myself or a family member Q14b, 26.4% 1.010
T88} S87] Being caught in an embarrassing moment on Zoom or video conference Q14h, 25.6% 1.075
T89} S91] Blood Q17a, 24.9% 1.354
T90} S88] Ghosts Q17k, 24.4% 1.379
T91} S90] Whites no longer being the majority in the US Q16p, 21.7% 1.350
T92} S92] Muslims Q19f, 19.0% 1.269
T93} S89] Zombies Q17p, 17.6% 1.318
T94} S93] Immigrants Q19e, 15.9% 1.217
T95} S94] Clowns Q17g, 15.0% 1.220

I was curious about whether the relative rankings shifted in going from the Sum to the Grand Sum. Only four fears had the exact same rank. A histogram for the differences is shown above. At a difference of 1 to 5 there are 26 changes versus – 1 to -5 where there are only 17 changes. Further negative, at larger differences, there is a fairly smooth curve.


