Saturday, October 28, 2023

Another big fear survey for Halloween of 2023 from SafeHome.org


An interesting article by Rob Gabriele at SafeHome.org on October 25, 2023 is titled What Americans Fear Most: 2023 Fear Ranking. It describes results from a survey of 2,634 U.S. adults.  


His description in the overview explains:


“To understand which concerns fuel America's anxiety, we asked participants to disclose how much they fear 72 unique situations across several general categories. After adjusting results to ensure an accurate representation of the population, we calculated ‘fear scores’ to quantify the collective fear associated with each subject. Scenarios with higher scores (closer to 100) indicate more people were afraid, and situations scores closer to zero were less frightening for our respondents.”


And the second paragraph under Our Data and Complete Fear Rankings elaborates:


“Fears were ranked by two metrics: The percentage of respondents who were afraid or very afraid of each scenario, and by a fear score. The fear score is a normalized weighted sum whereby ‘Very afraid’ was weighted 3, ‘Afraid’ was weighted 2, ‘Slightly afraid’ was weighted 1, and ‘Not afraid’ was weighted at 0. The number of responses for each is multiplied by their weight and summed together, then normalized by dividing by two times the total number of responses, then multiplied by 100 and rounded to the nearest integer.”


The Fear Score describes How Much?, while the percent Afraid or Very Afraid describes How Many? But his scaling for the Fear Scores is peculiar. One way to state it is on the scale from 0 to 3 described above. Back on October 30, 2015 I blogged about calculating fear scores in a post titled According to the 2015 Chapman Survey of American Fears adults are less than Afraid of federal government Corruption and only Slightly Afraid of Public Speaking.


A second way is to divide that number by three (a Corrected Fear Score), so it is a proportion (or multiply by a hundred to make it a percent). Instead he divided by two, which for these particular results fortuitously made the highest score 99 (almost 100).


The second paragraph of the article is titled Americans’ Top 10 Fears, 2023 and he just provides a list of the scenarios without either the Fear Scores or the percent Afraid or Very Afraid. As shown above, I have provided a table with both sets of percentages - which are surprisingly close to each other. 


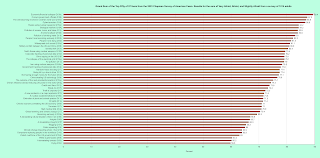
That similarity carries over to all 72 of the percentages for Very Afraid plus Afraid, as is shown in a pair of bar charts for the Top Forty and Bottom Thirty-Two fears. The corrected fear score is shown by the digits at the right in the caption for each scenario. Based on its corrected fear score of 41 public speaking ranks 28 of 72 fears at 41%.   


I was irritated that Mr. Gabriele did not bother to discuss the nine Chapman Surveys of American Fears, or compare his results with theirs. His questions are a smaller set similar to those in that set of surveys which began back in 2014.  


He did a similar survey of 41 fears in 2021, which is discussed in another article titled America’s Top 10 Fears: The 2021 American Fear Index. I had not discussed that one previously in this blog, since it did not include the fear of public speaking. As shown above in another table with both sets of percentages, the Top Ten there for Fear Scores and the percent Afraid or Very Afraid also are surprisingly close to each other.


The US flag fear frowny was adapted from this smiley at Openclipart.    


Thursday, October 26, 2023

A fear survey from a casino web site has text not matching the accompanying infographic


The Halloween holiday is coming up, so this month we get fear surveys as click bait. They appear at web sites with no obvious interest in surveying our fears. For example, there is an article by Rhiannon Odonohoe at Casino.org on October 18, 2023 titled Phobias: America’s Biggest Fears Across the Nation. In October 2023 they surveyed 2,500 U.S. residents across the country about their biggest phobias (really fears). The average age of respondents was 37.9 years old. Their sample was 50.9% female, 46.8% male, 1.7% non-binary, 0.4% transgender, and 0.2% other. Results for each state (and DC) are shown in an infographic with a table and U.S. map. My state of Idaho and Hawaii both had trypophobia (fear of clusters of holes) as the biggest fear.


It is really scary when the text of an article does not match the accompanying infographic. I tallied up the results and show them above on a bar chart. 21 states feared heights, 5 each feared social situations and spiders, 4 each feared death, failure, and snakes, 2 feared clusters of holes, crowds and public speaking, and only one each feared enclosed spaces and needles.   


But the text instead claimed her key findings are that:


“Acrophobia (the fear of heights) is America’s #1 phobia, according to 21 states.


Who said Americans were loud? Social phobia was voted as 6 states biggest phobia, making it America’s 2nd haunting fear.


Arachnophobia, the fear of spiders, ranks 3rd nationwide, according to 5 states.


Atychiphobia (the fear of failure), Thanatophobia (the fear of death), Trypanophobia (the fear of injections) and Ophidiophobia (the fear of snakes) tied for 4th overall.”


The other scary thing is that she confuses a fear with a phobia. As shown above via a Venn diagram, the definition for a phobia has conditions beyond just a fear. On December 8, 2019 I blogged about how Toastmasters press releases confuse a fear of public speaking with a social phobia.


Monday, October 23, 2023

What do American adults fear at some level? Results for the Grand Sum of Very Afraid + Afraid + Slightly Afraid levels (everything but the kitchen sink) in the ninth 2023 Chapman Survey of American Fears. Public speaking was ranked #44 at 65.0%.


The scary holiday of Halloween is coming soon, so in October Chapman University reported results from their ninth 2023 Chapman Survey of American Fears. That survey on 97 fears of 1014 adults was done by SSRS March 27 to April 4, 2023, and the margin of error is 3.7%. They asked about four fear levels: Very Afraid, Afraid, Slightly Afraid, and Not Afraid. They reported the percentage sum for Very Afraid plus Afraid. On October 20, 2023 I blogged about how Corrupt government officials (60.1) was the most common fear in the ninth Chapman Survey of American Fears. Public speaking only was ranked #53 (28.7%). Then on October 22, 2023 I blogged about What terrifies American adults? Corrupt government officials (29.8%) was the most common fear at the Very Afraid level in the ninth Chapman Survey of American Fears. Public speaking only was ranked #73 (10.4%).


Yet another way to report from that survey is “at some level” or “at any level” - by the Grand Sum of percentages for all three nonzero fear levels of Very Afraid + Afraid + Slightly Afraid. This slightly dishonest marketing tactic throws in “everything but the kitchen sink” to give the largest possible numbers – almost ninety percent. Never mind that Slightly Afraid really is not that significant. 


I have prepared a pair of bar charts for that data, the Top Fifty and Bottom Forty-Seven, which are shown above. (Click on them to see an enlarged view). For each entry I show the question number from the Methodology Report. Adding Slightly Afraid raises the percentage for public speaking from 28.7 to 65.0, and it now is ranked at #44 – barely in the Top Fifty. If you wish to give a rather awkward fraction, then 13 of 20 adults fear public speaking.  


How do the Top Ten for the Grand Sum compare with those for the sum of Very Afraid + Afraid? A table shown above reveals that eight of the ten fears are on both lists, but Corrupt government officials (87.3%) switched places from the top to second, and Economic/financial collapse (89.4%) moved up.


The kitchen sink was adapted from this 1941 image at the Library of Congress.


Sunday, October 22, 2023

What terrifies American adults? Corrupt government officials (29.8%) was the most common fear at the Very Afraid level in the ninth 2023 Chapman Survey of American Fears. Public speaking only was ranked #73 (10.4%)


In October Chapman University reported results from their ninth 2023 Chapman Survey of American Fears. That survey of 97 fears on 1014 adults was done by SSRS March 27 to April 4, 2023, and the margin of error is 3.7%. They asked about four fear levels: Very Afraid, Afraid, Slightly Afraid, and Not Afraid. They reported the percentage sum for Very Afraid plus Afraid. On October 20, 2023 I blogged about how Corrupt government officials (60.1) was the most common fear in the ninth Chapman Survey of American Fears. Public speaking only was ranked #53 (28.7%).  


Another way to report that survey is just by the Very Afraid level. Corrupt government officials again (29.8%) was the most common fear, and public speaking only was ranked #73 (10.4%). I have prepared a pair of bar charts of that data, the Top Fifty and Bottom Forty-Seven, which are shown above. (Click on them to see an enlarged view). For each entry I show the question number from the Methodology Report.


How do the Top Ten just for Very Afraid compare with those for the sum of Very Afraid + Afraid? The table shown above reveals that eight of the ten fears are on both lists, but only the top one is the same.


Friday, October 20, 2023

Corrupt government officials (60.1%) was the most common fear in the ninth 2023 Chapman Survey of American Fears. Public speaking only was ranked #53 (28.7%)


In October Chapman University reported results from their ninth 2023 Chapman Survey of American Fears. That survey of 97 fears on 1014 adults was done by SSRS March 27 to April 4, 2023, and the margin of error is 3.7%. They asked about four fear levels: Very Afraid, Afraid, Slightly Afraid, and Not Afraid. Details are in an April 2023 American Fears Survey Methodology Report which can be downloaded as a 96-page pdf file. That report mentions a fifth reply, a Web blank that is when people skipped answering a question. That reply appeared for fifteen questions: nine at 0.1%, four at 0.2%, and two at 0.4%. Those web blanks did not significantly affect the results.   


The Chapman University web page also provides links for pdf files with a Top Ten List, a Percent List, an Alphabetical list, and Chapman Survey of American Fears 2022 and 2023 Compared. They reported the percentage sum for Very Afraid plus Afraid. Corrupt government officials (60.1%) was the most common fear, and public speaking only was ranked #53 (28.7%)


I have prepared a pair of bar charts of that data, the Top Fifty and Bottom Forty-Seven, which are shown above. (Click on them to see an enlarged view). For each entry I show the question number from the Methodology Report.


Corrupt government officials was the most common fear for all eight surveys where questions were asked consistently. (That was not the case for the first one in 2014).


The comparison of 2022 and 2023 shows that five new questions about China were added, and replies were in the Top Thirty:


China spying on the US Q19f #13 45.7%

Military conflict between the United States and China Q19h #15 45.3%

China stealing US technology Q19e #19 44.1%

China’s influence abroad reducing US power in the world Q19g #27 40.7%

China’s economy overtaking the US economy Q19d #30 40.0%  


For eleven of the questions there was another reply for a significant percentage, but these results were not noted in the fear lists by Chapman. As shown above, for eight questions another reply was that I don’t know who/what this is. And for three more, another reply was that Doesn’t apply to me. They are shown above in a pair of tables.            


I have blogged a lot about results from the Chapman surveys. Some examples are for the 2014, 2015, 2016, 2017, 2018, 2019 2020/21, and 2022 ones. There are other metrics for reporting the survey results, which will be discussed later.


The cartoon was adapted from one at Puck magazine on September 5, 1906 at Wikimedia Commons.


Tuesday, October 17, 2023

Halloween and trick or treating are coming, so here are four bar charts of results from a survey about candy


There is an article from Shiny Smile titled 35% of Americans have suffered from candy-related dental issues which also includes four sets of percentage results from a survey of 1,002 U.S adults done on August 25, 2023. 


First, there is the question of which is the best candy to receive on Halloween. A bar chart shows the Top Twenty. The top three are Reese’s Peanut Butter Cups (51.8%), M & M’s (48.2%), and Kit Kat (41.0%). 


Second, there is the question of which is the worst candy to receive on Halloween. Another bar chart shows the Top Twenty. The top three are Candy Corn (36%), Hot Tamales (26.1%), and Atomic Fireball (23.9%). 


Third, there is the question of which candies get stuck in your teeth. A third bar chart shows the Top Ten. The top three are Laffy Taffy (45.1%), Bit-O-Honey (35.2%), and Tootsie Roll (34.1%).   


Fourth, there is the question of which candies people loved as a kid but won’t touch now. A fourth bar chart shows the Top Ten. The top three are Jawbreaker (31%), Candy Corn (24.2%), and Blow Pops (19.0%)


Also, 39% avoid certain candies for dental reasons. Over a third of Americans have had candy-related accidents to their teeth. And Americans spend an average of $538.28 fixing their teeth after a dental accident caused by candy. Five dental issues Americans have experienced after eating candy are: teeth sensitivity, tooth pain, damaged fillings/crowns, chipped or cracked teeth, and jaw discomfort. There also is just a list of the Top Ten candies that have caused dental issues: Jawbreaker, Jolly Rancher, Bit-O-Honey, Starburst, Tootsie Roll, Laffy Taffy, Snickers, Atomic Fireball, Butterfinger, and a tie for tenth between Blow Pops and Milk Duds.


Lewis Black has a comedy routine about Candy Corn, which can be heard in a two-minute YouTube video.


There is a Sheldon comic on shrinkflation in the candy aisle with five renamings:


Snickers now is Snicker

M &  Ms now is M & That’s It

Mike & Ike now is Just Mike

Twix now is Twik

3 Musketeers now is 1 Musketeer..but he’s doing his best


The image of a house at Halloween was modified from this one at Openclipart.


Sunday, October 15, 2023

An October 2023 web article by Eva Finn in Toastmaster magazine cites an article from 2000 rather than a 2022 survey from the university where she is a professor


There is a decent web article by Eva Finn in the October 2023 Toastmaster magazine titled 5 Tips to Land a Job or Internship. (Eva is an assistant artistic professor at Chapman University’s Dodge College of Film and Media Arts). But the second sentence in Eva’s fourth paragraph claims:


“According to a Columbia State Community College study, public speaking anxiety is very common, not just among college students but the rest of the population as well.”


That article is by Louise Katz. It is from back in 2000 and just titled Public Speaking Anxiety. Louise opens by stating that:


“Public speaking anxiety is very common among both college students and the general population. Some estimates are that as many as 20-85% of people experience more or less anxiety when they need to speak in public.”


The 85% came from a 1988 article by Michael T. Motley that I blogged about on September 29, 2020 in a post titled A quantified version of a discredited Mark Twain quotation about fear of public speaking.


The Wilkinson College of Arts, Humanities, and Social Sciences at Chapman University does an annual Survey of American Fears. The list from their eighth 2022 survey, which reports the sum for Very Afraid plus Afraid, found that fear of public speaking was ranked #46 of 92 fears at 34.0% (barely over a third). And results from the ninth 2023 survey just came out. For 2023 public speaking is  on the list at #53 of 97 at 28.7%. And their detailed results for 2022 and 2023 reported fears at four levels: Very Afraid, Afraid, Slightly Afraid, and Not Afraid.  


The bar chart shown above gives all the results from those two Chapman surveys. Why didn’t Eva report them rather than pointing way back to 2000?   


Toastmasters previously hasn’t reported results from the Chapman Survey. I mentioned this back on October 26, 2017 in a blog post titled How can you make a public speaking coach run away like a scared zebra? Just tell them where fear of public speaking ranked in the fourth Chapman Survey on American Fears.


The cartoon image was adapted from this one at Openclipart.


Saturday, October 14, 2023

Visiting Buchart Gardens near Victoria, British Columbia on September 28, 2023


From September 22 through 29 my wife Elaine and I went on an ocean cruise from Seattle to Alaska on the Royal Caribbean ship Ovation of the Seas. We arrived in Victoria, British Columbia on September 28 at 11:00 AM. Then we rode a double-decker shuttle bus twenty miles north to the famous, 55-acre Buchart Gardens for a three-hour overdose of beautiful flowers.


Back on July 16, 2021 I blogged about Heritage Interpretation – telling historical stories to people. Often that is done via plaques. The Buchart Gardens have outstanding green-bordered ones, usually with before pictures. (Click on an image for a larger view). It was adapted from a rock quarry beginning nearly twelve decades ago.


First there is the lovely Sunken Garden.


Then there is the spectacular Ross Fountain.  


And there also is a dragon fountain. 


There is a Japanese Garden and a Rose Garden. Both roses and dahlias were blooming.


There is a shady forest with topiaries (arrow).


Everywhere you look there are beautiful trees and shrubs.


Other attractions include totem poles, a carousel, and sculptures.


Near the entrance there is a waterwheel and harvest displays.


On the way back to the ship we passed though Chinatown and downtown. We departed at 10:00 PM. Sometime in the future we plan on driving from Boise to Vancouver, and then taking a ferry over to Victoria for a day or two.